
Introduction — Why this matters now
Ever feel like your recordings tell half the story? I do — and that’s the starting point for most labs trying to read fast neural signals. A fiber photometry system sits at the heart of those experiments, translating tiny fluorescence changes into data we can actually use. Picture this: you’re tracking calcium transients in freely moving mice and a single noisy trace costs you hours of analysis (and a weekend). Recent surveys suggest many groups see inconsistent signal quality across sessions — and that’s not just frustrating, it slows discovery.
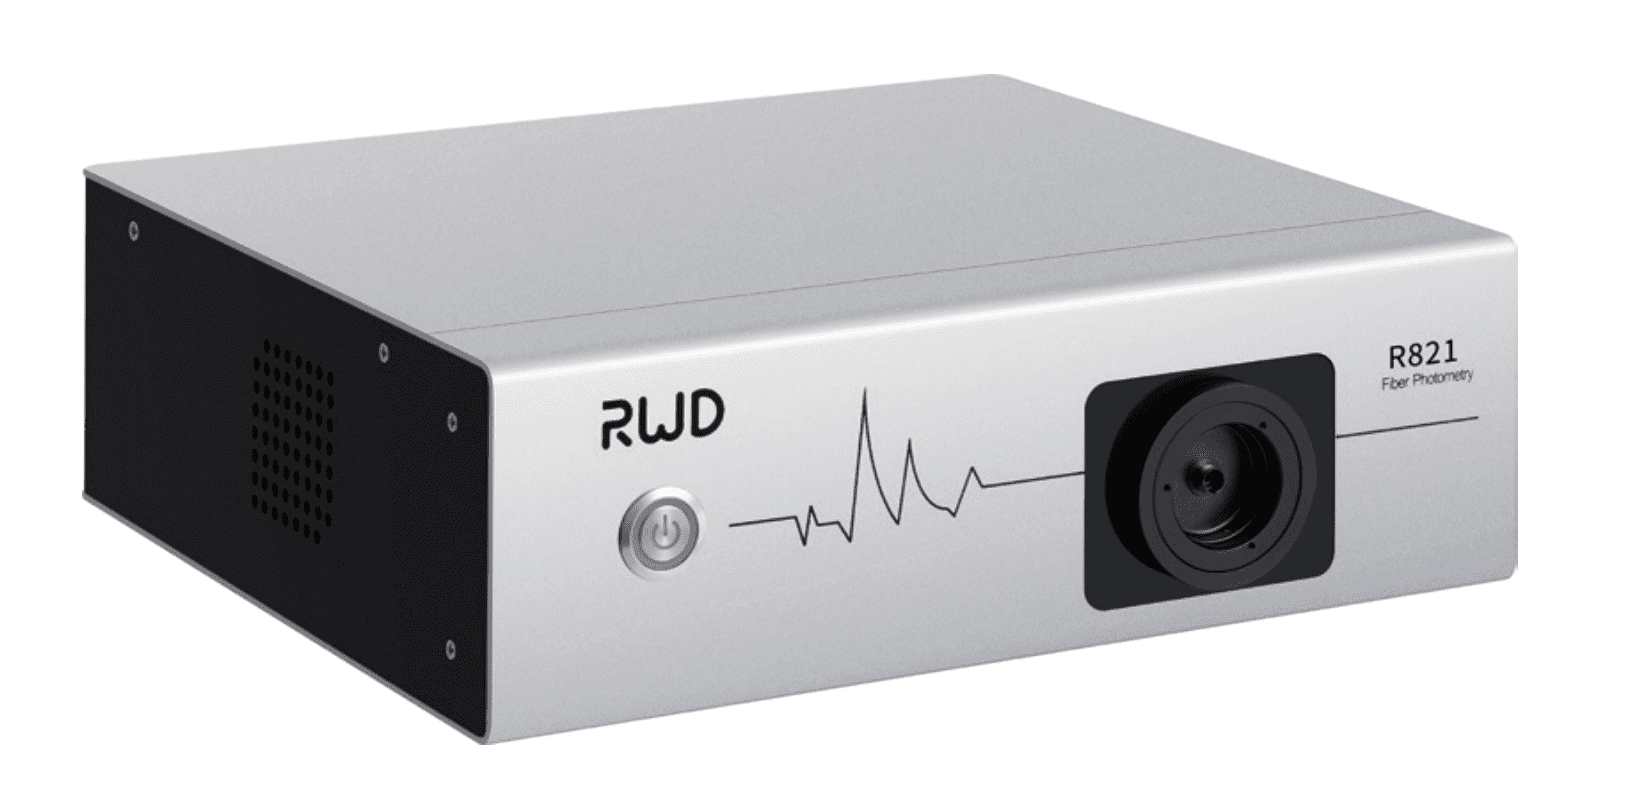
I want to motivate you: small changes in setup and mindset can sharpen your traces and speed up experiments. Let’s look at a concrete scenario — a lab running 10 sessions per week with variable baselines — and ask: how can we cut re-runs, boost signal-to-noise, and get cleaner, more reproducible data? I’ll walk you through practical moves that I’ve used and seen work in real labs, with a few technical tips tucked in. Ready to tighten the chain from fiber to readout? — then onward we go.
Deep dive: The hidden flaws in standard fiber photometry mice setups
When teams first adopt fiber photometry mice, the workflow seems simple: implant, connect, record. But I’ve noticed (and I’m not alone) that small, overlooked weaknesses compound quickly. The biggest offenders are inconsistent optical coupling, drift in LED driver output, and photobleaching that creeps into long sessions. These are not glamorous problems, but they wreck your signal fidelity and inflate downstream analysis time.
What exactly goes wrong?
Technically speaking, the photodetector can be starved or swamped by small misalignments in the optical fiber coupling. That wrecks your signal-to-noise ratio right out of the gate. Then there’s baseline drift — often from temperature changes or LED driver instability — which fools simple peak-detection scripts into false positives. Finally, photobleaching changes your fluorescence baseline over minutes, not hours, and that undermines comparisons across trials. I’ve seen labs lose 20–30% of usable trials because they didn’t control for these factors.
Look, it’s simpler than you think: inspect the ferrule-to-fiber contact every session; record LED driver telemetry if possible; and run brief photobleaching tests before key trials. Use a lock-in amplifier or modulation strategy when ambient light or movement is an issue. That introduces another layer of hardware (and the learning curve), but the payoffs—cleaner traces and fewer reruns—are immediate. I recommend a short checklist to run before you start: coupling check, LED stability check, baseline drift run, and a photobleach test. Do those, and you avoid a bulk of the usual headaches.
Future outlook — Practical next steps and how to evaluate new options
Looking ahead, the most promising advances tie better hardware stability to smarter analysis. I’m thinking modular LED drivers with feedback, fiber connectors designed for repeatable coupling, and software that flags drift in real time. For teams that use fiber photometry mice, that means fewer surprises and faster throughput. In practice, I expect these improvements to cut trial loss and boost reproducibility — and yes, that matters when you publish or scale experiments.

What’s next for labs like mine?
Start by comparing systems on three practical axes: stability, ease of alignment, and analysis support. Stability covers LED driver consistency and photodetector linearity; ease of alignment includes connector design and tolerances for movement; analysis support means real-time QC flags and baseline correction tools. I use these criteria when advising colleagues — and they’re simple to measure in a 48-hour test run (record baseline drift, measure photobleaching rate, and log coupling failures). — funny how that works, right? Small tests give big clarity.
To wrap up, here are three concrete metrics I use to evaluate solutions: 1) baseline drift per hour (mV/hour or % fluorescence), 2) coupling repeatability (variance in peak amplitude across reconnections), and 3) effective signal-to-noise ratio during behavior. If a system beats your current setup on two of these, it’s worth trialing. I’ve tried several approaches and now favor solutions that balance robust hardware with smart software checks. For teams ready to level up, check out vendors that publish these numbers transparently — and consider partnering with groups that field-test gear in real behavioral setups. For practical options and tested systems, I trust resources like BPLabLine for clear specs and support.
